Metrics Every SaaS Company Needs To Pay Attention To
If you're in the business of software-as-a-service (SaaS), then you know that having the right metrics in place is critical to your success. But what saas metric should a SaaS company be tracking?
We will cover the following:
- What are SaaS metrics?
- Why SaaS companies report on different metrics?
- The most important metrics for SaaS companies
- The 10 SaaS metrics
- Growth metrics
What are SaaS metrics?
The term SaaS (Software as a Service) refers to software applications that companies offer over the Internet. These include things like email, office productivity suites, customer relationship management tools, etc.
SaaS metrics can be used to monitor performance of software-as-a-service companies. Typically SaaS businesses have success in enrolling and retaining existing subscribers. SaaS metrics can help in predicting business performance when properly used.
Every SaaS company has its own unique set of metrics that they track to measure their success. SaaS (software as a service) metrics are performance indicators that help businesses track, measure, and optimise their SaaS applications.
SaaS metrics are typically divided into four main categories: financial, customer, product, and engagement.
- Financial metrics focus on indicators such as revenues, costs, and profitability.
- Customer metrics track customer acquisition, retention, and satisfaction levels.
- Product metrics measure key performance indicators such as feature usage and engagement.
- Engagement metrics focus on indicators such as session duration and frequency, bounce rate, and time on site.
By tracking these and other key metrics, businesses can gain insights into which areas of their SaaS applications are performing well and which need improvement.

Why SaaS companies report on different metrics?
SaaS providers report varying metrics based on their business model, growth stage, and cost. As their growth changes, their critical statistics change.
There are a few reasons why SaaS companies report on different metrics:
1. They may be in different stages of their business. For example, a startup SaaS company may be focused on growth and may be reporting metrics like customer acquisition costs (CAC) and churn rates. A more established SaaS company may be focused on profitability and may be reporting metrics like gross margin and customer lifetime value (LTV).
2. They may have different business models. For example, a subscription-based SaaS company may be focused on recurring revenue, while a one-time purchase SaaS company may be focused on customer acquisition.
3. They may have different target markets. For example, a B2B SaaS company may be focused on enterprise customers, while a B2C SaaS company may be focused on consumers.
4. They may have different go-to-market strategies. For example, a direct sales SaaS company may be focused on selling to large enterprises, while a channel sales SaaS company may be focused on selling to small and medium businesses through partners.
The Most Important Metrics For SaaS Companies
Four key SaaS metrics include:
-Churn rate: This is the percentage of customers who cancel their subscription. A high churn rate is a sign that something is wrong with your product or pricing.
-Customer lifetime value: This is the average amount of money a customer spends with your company over the course of their lifetime. A high customer lifetime value is a sign that your product is valuable and that customers stick around for the long haul.
-Monthly recurring revenue: This is the amount of money you're bringing in each month from subscriptions. A high monthly recurring revenue is a sign that your business is growing and accumulating positive cash flow.
-Customer acquisition costs: This is the amount of money you're spending to acquire new customers. A high customer acquisition cost is a sign that you need to either improve your product or your marketing.
Make sure you're tracking these metrics so you can gauge the health of your business and make necessary improvements.

The 10 SaaS Metrics
The success of an organization is measured through 100 different measures. These metrics form the base for most profitable SaaS growth strategies:
- Customer Churn
- Revenue Churn
- Customer Lifetime Value
- Customer Acquisition Cost
- Months to Recover CAC
- Customer Engagement Score
- Qualified Marketing Traffic
- Leads by Lifecycle Stage
- Lead-to-Customer Rate
- Customer Health Score
#1 Customer churn
Customer churn is when a customer or group of customers discontinue using a product or service. This can happen for a variety of reasons, such as poor customer service, a competitor offering a better product, or simply because the customer no longer needs the product.
If a company has a high churn rate, it can be a sign that there is a problem with the product or service that needs to be addressed. Companies can use customer churn data to help identify areas where they need to improve in order to reduce the number of customers who leave.
There are a few different ways to calculate customer churn, but the most common is to take the number of customers who have left in a given time period and divide it by the total number of customers at the beginning of that period. This gives you the churn rate as a percentage.
For example, if a saas company starts the year with 1,000 users and ends the year with 900, their customer churn rate would be 10%.
Customer churn can be a major problem for companies, especially if it is high. A high churn rate can lead to a decrease in revenue and profit, as well as an increase in the cost of acquiring new customers.
Reducing customer churn is often a top priority for companies, and there are a number of ways to do it. Some common strategies include offering discounts or incentives to customers who stay, improving customer service, and making changes to the product or service to make it more appealing to customers.
#2 Revenue Churn
Revenue churn is the percentage of recurring revenue that is lost in a given time period. This is a key metric for companies that rely on recurring revenue, such as subscription-based businesses. A high revenue churn rate can indicate that a company is having trouble retaining customers.
There are a few different ways to calculate it, but the most common is to divide the amount of recurring revenue lost in a period by the total amount of recurring revenue at the beginning of that period. The revenue churn rate is the percentage of revenue that is lost each month due to customers cancelling their subscription or service.
For example, if a company has $100,000 in recurring revenue at the beginning of a month and loses $10,000 in recurring revenue during that month, its revenue churn rate for that month would be 10%.
Another way to look at revenue churn is in terms of customer churn. If a saas has 100 users (number of active users) at the beginning of a month and loses 10 users during the month, its customer churn rate would be 10%. However, if those 10 users each had $10,000 in recurring revenue, the company's revenue churn rate would be 100%.
There are a few different ways to reduce revenue churn, such as offering discounts or perks to customers who stay with the company, or improving the customer experience.
#3 Customer Lifetime Value
Customer lifetime value (CLV) is a metric that estimates the total value of a customer relationship, based on the present value of future cash flows from the customer.
CLV can be used to help businesses make decisions about acquisition, customer retention, and investment in customer relationships. For example, if the CLV of a customer is estimated to be $1,000 and the cost of acquiring a new customer is $500, then it may be worth investing in acquisition & retention.

There are a number of different methods that can be used to calculate CLV, and the choice of method will depend on the data available and the specific business context.
The most common method is to use a discount rate to calculate the present value of future cash flows from the customer. Other methods include using customer profitability models or customer lifetime value models.
#4 Customer Acquisition Cost
The customer acquisition cost (CAC) is the total cost incurred by a company in acquiring a new customer. This cost can be divided into two categories:
- Hard Cost - The cost of acquiring new customers through paid channels, and
- Soft Cost - The cost of acquiring new customers through organic channels.
Paid channels include paid search, display advertising, social media advertising, and email marketing. The cost of acquiring new customers through paid channels can be measured by the cost per click (CPC) or the cost per acquisition (CPA).
Organic channels include search engine optimisation (SEO), content marketing, and social media marketing. The cost of acquiring new customers through organic channels can be measured by the cost per lead (CPL) or the cost per thousand impressions (CPM).
The cost of acquiring new customers through word-of-mouth or other organic means is more difficult to measure, but can be estimated by the customer lifetime value (CLV).
The CAC is an important metric for companies to track because it provides insight into how much it costs to acquire new business. Additionally, tracking the CAC over time can help companies identify trends and optimise their acquisition strategies.
To calculate the CAC, divide the total cost of acquiring new customers by the number of new customers acquired. For example, if a company spends $1,000 on advertising and marketing to acquire 10 new customers, the CAC would be $100.
If a company wants to reduce its CAC, it can focus on reducing the hard costs associated with customer acquisition or improving the efficiency of its acquisition process. Additionally, the company can focus on increasing the lifetime value of its users to offset the costs of acquisition.
#5 Month To Recover
The average time it takes to recover the cost of customer acquisition (CAC) is 3-5 months. This varies greatly depending on the business, saas industry, and other factors. To ensure a healthy business, it is important to keep a close eye on your CAC and make sure that your marketing and sales efforts are focused on reducing this number over time.
There are a number of ways to reduce your CAC, including improving your lead generation efforts, conversion rates, and product pricing. In addition, you can focus on building a loyal customer base that is less likely to churn. By reducing your CAC, you will be able to increase your profits and scale your business more effectively.
#6 Customer Engagement Score
The Customer Engagement Score (CES) is a metric that measures how engaged a customer is with a company or brand. It is typically calculated as a percentage, using data from surveys or customer feedback.
The CES can be used to measure customer engagement across all touch-points, including customer service, product usage, and marketing communications. A high CES indicates that customers are highly engaged and are more likely to be loyal and make repeat purchases. A low CES indicates that customers are less engaged and may be at risk of churning.
To calculate the CES, companies first need to determine the number of customer engagement touchpoints. This can be done by surveying customers or using customer feedback data. Once the number of touch-points is known, the CES can be calculated by dividing the number of engaged customers by the total number of touch-points.
The CES is just one metric that can be used to measure customer engagement. Other metrics, such as customer satisfaction or Net Promoter Score, can also provide insights into customer engagement.
#7 Qualified Marketing Traffic
Qualified marketing traffic is traffic that is specifically targeted to your product or service. This traffic is more likely to convert into customers or clients than general traffic, because they have already shown an interest in what you have to offer.
There are many ways to generate qualified marketing traffic. You can use online advertising, such as Google AdWords, to target keywords related to your product or service. You can also use social media platforms, such as Facebook, to target specific demographics that may be interested in your product or service.
It is important to track your qualified marketing traffic so that you can see which methods are generating the most results. This information can help you adjust your marketing strategy to focus on the methods that are generating the most qualified traffic.
Qualified marketing traffic is essential for any business that wants to succeed online. By targeting your marketing efforts to specific groups of people who are interested in your product or service, you can significantly increase your chances of converting them into customers or clients. This ensures customer success.
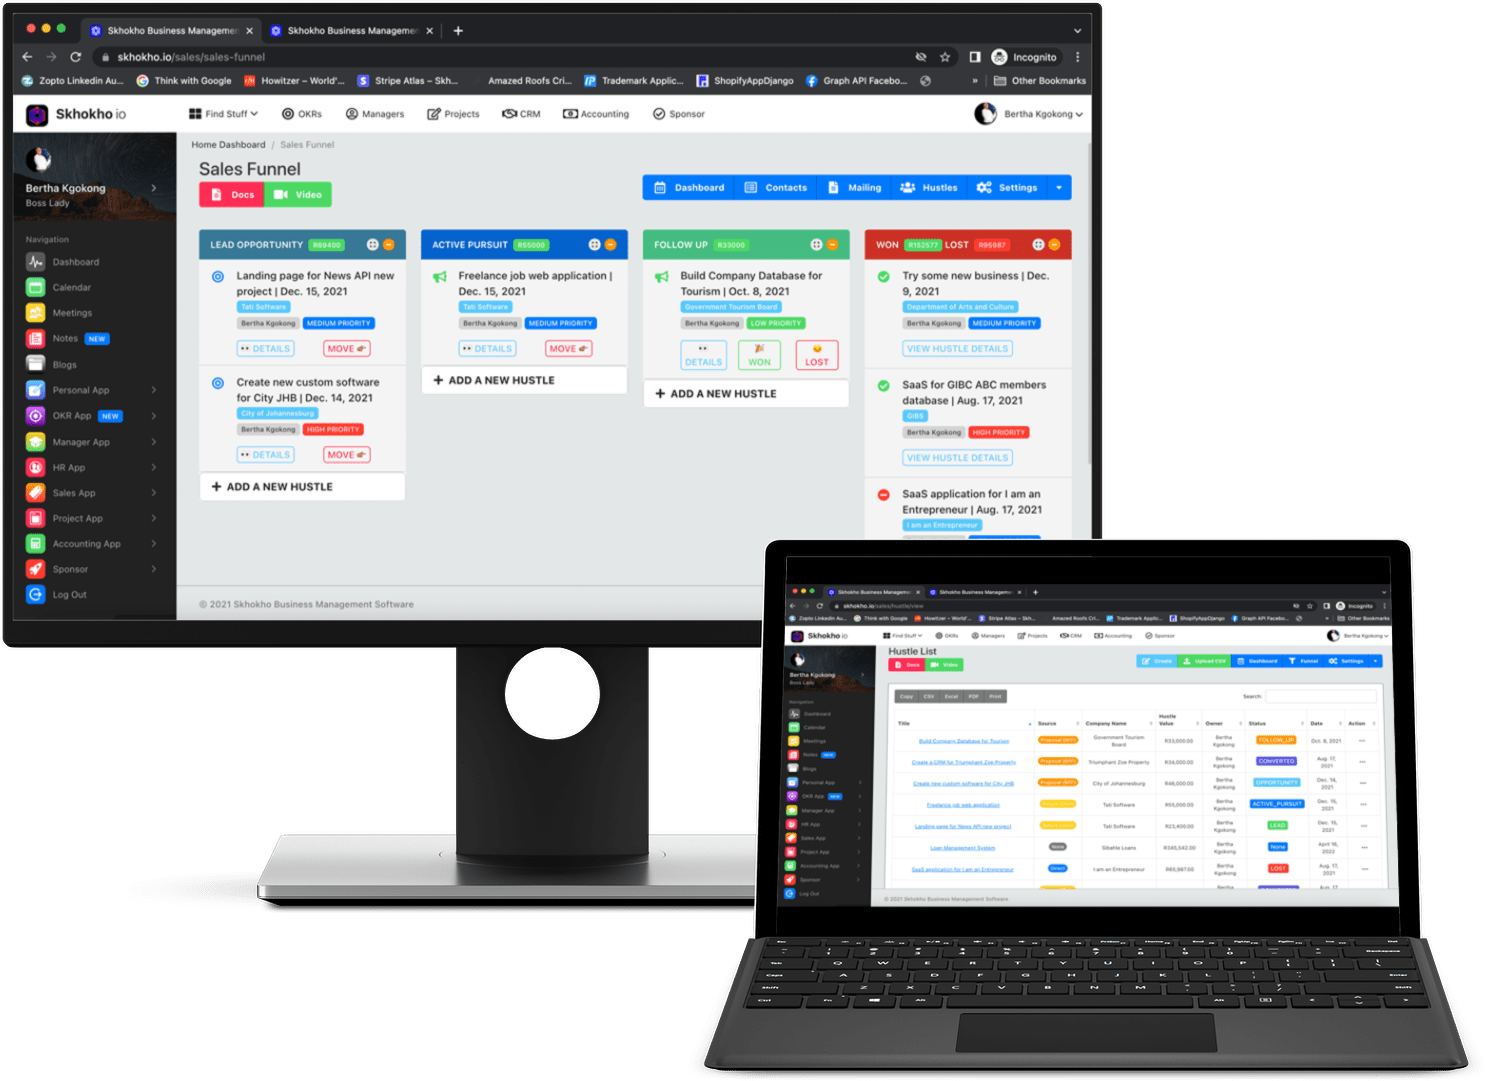
You can successfully track this using other Skhokho Sales & CRM . Skhokho Allows you to monitor your entire Sales effort. For more information on skhokho Sales and CRM, visit this page; https://skhokho.io/crm-sales-management-software-business-development
#8 Leads by Lifecycle Stage
The Leads by Lifecycle Stage report is a great way to see how your leads are progressing through your sales pipeline.
This report will show you how many leads are in each stage of your sales pipeline, as well as how many leads have been contacted, qualified leads, and closed.
This report is a great way to keep track of your sales pipeline and make sure that your leads are moving through it efficiently.
The Leads by Lifecycle Stage report is available in the Skhokho reports section.
#9 Lead-to-Customer Rate
The lead-to-customer rate is the percentage of leads that are converted into customers. Lead-to-customer rate is also known as lead conversion rate.
This metric is important because it allows you to track the effectiveness of your lead generation efforts. If you are generating a lot of leads but they are not converting into customers, then you need to revisit your lead generation strategy.
To calculate your lead-to-customer rate, simply divide the number of leads that you converted into customers by the total number of leads that you generated.
For example, if you generated 100 leads and converted 10 of them into customers, then your lead-to-customer rate would be 10%.
If you want to increase your lead-to-customer rate, then you need to focus on generating higher quality leads and/or improving your conversion process.
Assuming a lead is a prospect who has started their research, then you might see two subcategories at the later stages of the lead lifecycle:
Marketing qualified lead (MQL): Prospects who have conducted additional research by creating an account and returning to your website.
Sales qualified lead (SQL): A prospect who has moved beyond the initial research phase, is most likely evaluating software features, and is worth a direct sales follow-up.
#10 Customer Health Score
A customer health score is a metric that measures how likely a customer is to churn. It is a number between 0 and 100, with 0 being the lowest risk and 100 being the highest risk.
There are a number of factors that contribute to a customer's health score, including but not limited to:
- How long they have been a customer
- How often they use your product or service
- Whether they are engaged with your brand
- Whether they are at risk of churning
There are a number of different ways to calculate a customer health score, but the most important thing is to ensure that it is constantly updated and that you are taking action based on the score.
If a customer has a low health score, it is important to reach out to them and see what you can do to improve their experience. If a customer has a high health score, it is important to keep them engaged and ensure that they are getting the most out of your product or service.
Growth Business Metrics
Growth rate indicators are individual statistical and report types measuring a company' s performance. These metrics show how well the company's past performance has benefited. Organizational growth metrics are used to determine business plan goals and identify short and long-term opportunities. This section covers some crucial growth metrics for any SaaS company, including customer churn life value and acquisition cost. Despite the growth metrics listed above, SaaS businesses still require a number of other things.
Three important growth metrics:
Recurring Revenue (Monthly Revenue & Annual) - Recurring revenue measures how much all of your customers spend on your products on a continuous monthly basis or annually.
Expansion Revenue - By examining the additional money you make from your current customers, expansion revenue can tell you if your business is providing this increased value for its clients.
Net Promoter Score NPS - A quantitative and qualitative report on customer happiness at your business is called Net Promoter Score, or NPS. Customers are prompted to rate their interactions with your business on a scale of numerical ratings, and to briefly explain why they selected the rating they picked.
Conclusion
Any SaaS company can expand its clientele and succeed by comprehending, monitoring, and enhancing the metrics mentioned above. Additionally, the improvements do not need to be significant. Even modest modifications might help maintain the health of your company.


